Visionmaker NYC version 1.0 Methods: Geography
Eric W. Sanderson
Wildlife Conservation Society, 2300 Southern Blvd., Bronx NY 10460
19 January 2014
© Wildlife Conservation Society, 2014
Please submit comments or suggestions to m2409@themannahattaproject.org
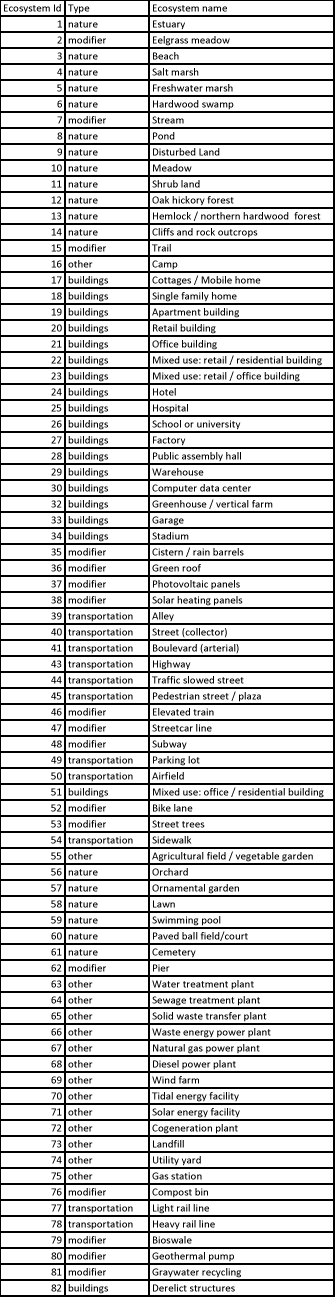
Visionmaker NYC covers Manhattan Island and surrounding estuary waters within 1 km of the modern city shoreline. Ecosystems are mapped on a 100 m2 grid (10 m cells), which provides 40 – 60 grid cells for most blocks in Manhattan. The term “ecosystem” is used broadly in this case: it includes buildings, streets, sidewalks, utility yards, parks, agriculture, and green roofs, as well as forests, wetlands, beaches, and estuary waters. The supported list of ecosystems provided is given in Table 1. Each ecosystem represents a cluster of properties described by a set of parameters, accessible throughout the interface by clicking on the small (i) icons (for example, on the ecosystem painting tools) or here.
Although the fundamental grain of the analysis is 10 m2, the smallest area of interest that the user can define is a single city block. The area of interest, or “vision extent”, is defined as one or more blocks selected by the user. Blocks are defined using the centerlines of the streets based on the City of New York Department of City Planning’s DCP LION shapefile, or in parks and waterways, through arbitrary subdivision using paths or other obvious dividing features. Blocks vary in size from 501 m2 (Herald Square) to over 15 million m2 (New York Harbor). The user can work with as many blocks in one vision extent as he or she chooses up to the extent of Manhattan plus estuary defined above; these multiple block selections allow the user to investigate environmental solutions over different vision extents. The magnitude for the various model estimates obviously varies with the area of the vision extent.
The 10 m x 10 m analysis grid is defined on the Universal Transverse Mercator (UTM) zone 18 north map coordinate system on the WGS84 datum and displayed as web Mercator so that it aligns with aerial photography / satellite imagery of the city served by ESRI (Redlands, CA) as described here.
Pre-development ecosystems are provided based on the Mannahatta Project data (Sanderson 2009) and are referred to as the "Welikia (1609) vision." The original 55 ecological community types, based on Edinger et al. (2001), and as outlined in Sanderson (2009) and Sanderson and Brown (2008), have been collapsed into 13 natural ecosystem types under the “nature” ecosystem painting tool. Many of these natural ecosystem types are still extant in the city, though with much lower abundance and generally lower function than prior to development. Henry Hudson, an English sailor in Dutch employ, sailed into New York harbor on or around September 12, 1609, and from that moment, the history of New Amsterdam, later New York City, can be said to have begun.
Contemporary ecosystems are referred to as the "New York City (2014)" vision since they are based on the MapPLUTO datatbase for 2014, supplemented by a wide variety of other datasets from 2008 – 2013. Note that many of the ecosystems we have tried to map have not been comprehensively catalogued, especially on private property, so is very likely that we underestimate the abundance and distribution of many ecosystems, especially ecosystem modifiers like compost bins, cisterns/rain barrels, geothermal pumps, etc. We supplemented the Map-PLUTO database as follows:
- Street trees: from NYC Open Data
- Streets, elevated trains, subways, highways: from City of New York Department of City Planning's LION dataset. We assigned transportation types using the classification described by the City of New York's Department of Transportation (2008) Sustainable Streets report.
- Solar panels / pv panels: from NYC Solar Map.
- Compost bins: from NYC Open Data and GrowNYC for all green markets that compost.
- Bioswales/green roofs/cisterns/rain barrels: from NYC Open Data.
- Bike lanes: from the New York City Department of Transportation.
- Estuary/ponds/streams: from NYC Open Data.
- Playgrounds/Lawns/Swimming pools/Paved balls fields/courts: from NYC Open Data's open space data set and parks data set.
- Salt marsh: from City of new York Parks and Recreation Department, especially in Inwood Hill Park.
- Oak hickory forest: from City of New York Parks and Recreation Department, especially in the North Woods of Central Park.
- Pedestrian plazas: from the Municipal Arts Society, NYC Open Data 3ft. LiDAR data, and OpenStreetMap.
- Sidewalks: from NYC Open Data pavement edges and building footprints; and OpenStreetMap
When results are shown for the Welikia (1609) or New York City (2014) data in the environmental performance dashboard (accessed through the environmental performance tab on the left side of the interface) they are calculated based on the user’s vision extent, using the ecosystem data from the 1609 or 2014 vision, respectively. The ecosystem areas shown in the data summary are based on counting cells in the vision extent and multiplying by 100 m2.
This functionality allows users to interact with the city in two fundamental ways: by choosing an area to change (the “vision extent”) and by changing the ecosystems within that area. Users can also choose from a pre-defined set of lifestyle scenarios; and from a pre-defined set of climate scenarios. The combination of the map, the lifestyle, and climate comprise the user’s vision. The ecosystem and other selections are defined by a set of parameters necessary to make calculations of metrics for geography, population, carbon, water, and biodiversity (collectively referred to as “environmental performance indicators”). The model methods currently do not take into account the arrangement of the ecosystems within the vision extent, with the exception of the shared wall calculation made as part of the carbon model. Model logic for internal arrangements will likely be added in a future version.
The height of each ecosystem on a cell by cell basis for the New York City (2014) vision is defined using a combination of the built “floor to area ratio” (FAR) for each lot, as defined in the city MapPLUTO database, and the building footprints. For built ecosystems, cell height is determined on a per-building basis using building footprints provided by the City of New York Department of City Planning. These building footprints were joined to MapPLUTO by tax lot identifier. MapPLUTO contains an attribute field that reports the maximum number of floors of any structure on a tax lot. We divided the reported building area by the area of the building footprint, which results in an average cell height across the entire building footprint area. In cases where more than one building footprint is found per tax lot, the building areas for each building were summed and divided by the summed area of the building footprints. As a result, building heights will be averaged across a tax lot. For a given tax lot this method means that if we multiply the building heights by the building areas, we will obtain the same floor area estimates as contained in MapPLUTO.
All non-built ecosystem types are assigned a height of “one story” for both New York City (2014) and Welikia (1609). Users can set the number of stories when using built ecosystem painting tools (look for a dialogue on the ecosystem painting tool window. Users can set building heights to an arbitrarily large value. The default is 1. For calculations of wall height, used in the carbon model, single stories are assumed to be 3.5 m high.
We estimate “usuable areas (floor area)” by multiplying the height of each ecosystem within the vision times an ecosystem-dependent parameter called “proportion of use by ecosystem type,” and then sum across ecosystem types.
Validation
We validated the Visionmaker NYC estimates of floor areas for New York City (2014) against estimates derived from the MapPLUTO database. Not surprisingly, because we use MapPLUTO as a primary source of geographic information, we find a strong concurrence. Although this test does not prove that the estimates are correct, it does suggest the Visionmaker NYC model has fidelity with its underlying source data.
Figure 1
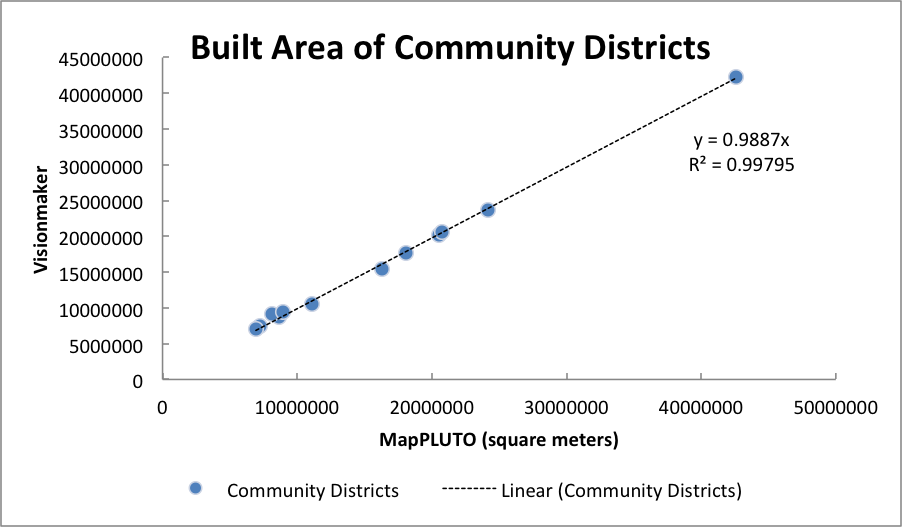
Figure 1. Comparison of total reported building area from MapPLUTO and floor area calculations (excluding transportation uses) from Visionmaker for community district visions for New York City (2014).
Figure 2
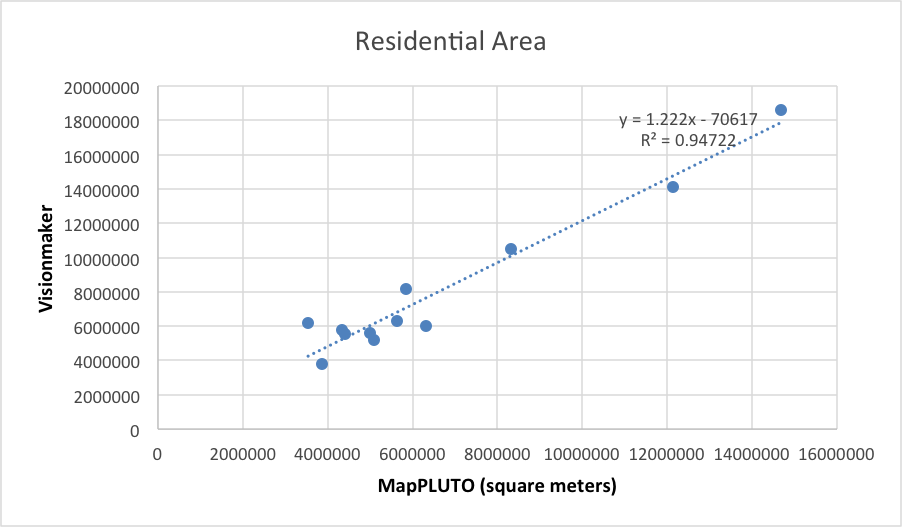
Figure 2. Comparison of residential area between MapPLUTO (ResArea field) and Community District-level calculations from Visionmaker for community district visions for Manhattan (2010
Figure 3
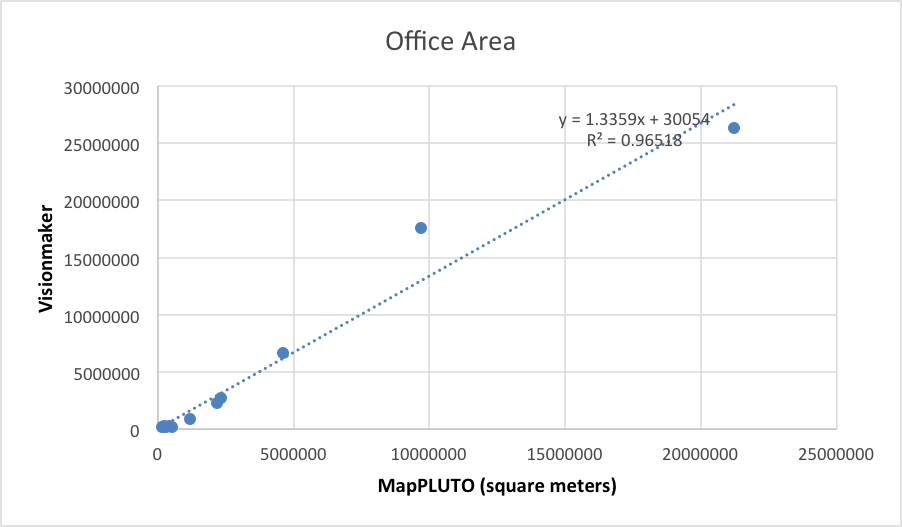
Figure 3. Comparison of office area between MapPLUTO and Community District-level calculations from Visionmaker for community district visions for New York City (2014).
Figure 4
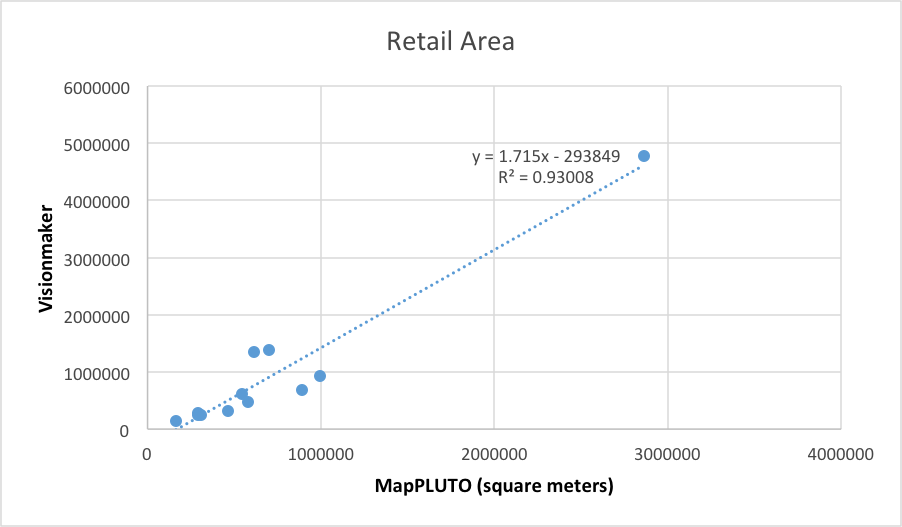
Figure 4. Comparison of retail area between MapPLUTO and Community District-level calculations from Visionmaker for community district visions for New York City (2014).
Table 1. List of available ecosystems and modifiers