Visionmaker NYC Methods: Biodiversity
Eric W. Sanderson
Wildlife Conservation Society, 2300 Southern Blvd., Bronx NY 10460
Marci Meixler
Department of Ecology, Evolution and Natural Resources
Cook College, Rutgers University, New Brunswick, NJ 08901
© Wildlife Conservation Society, 2016
Please submit comments or suggestions to m2409@themannahattaproject.org.
Potential species diversity (also known as species richness) is estimated using taxon-specific species-area relationships. A species-area relationship (SAR) represents how the number of species varies as a function of area, following a distinctive form that is one of the best known relationships in ecology (Rosenzweig 1995). Available habitat area is estimated in a taxon-specific way to estimate potential species diversity. The calculation process is made up of the following steps where: blue boxes denote inputs, white boxes with blue outlines denote steps in the process, boxes on grey background denote changes to the potential species list, and the pink box denotes the end result.
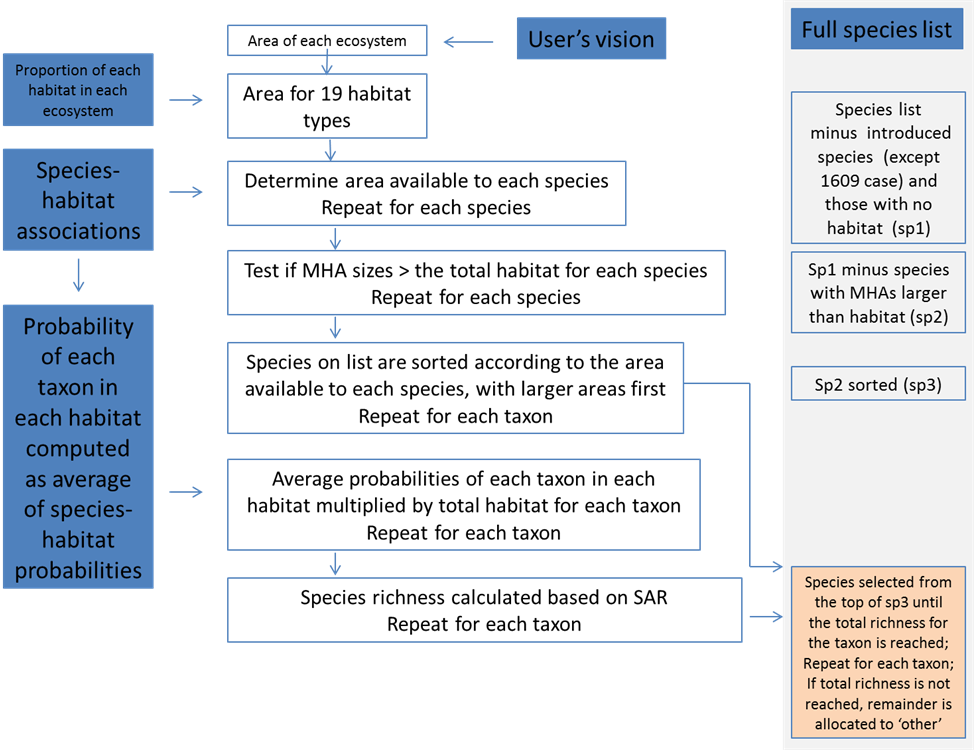
The steps are as follows. First, we estimate habitat areas based on the user's vision. We do this by reclassifying the ecosystems into habitat types. Habitat types in this usage refers to how non-human organisms see the city, differentiating natural ecosystems into unique ecological community types and lumping built ecosystems into a generic "pavement and buildings" type. Most of the natural ecosystems have a corresponding habitat type (e.g. all of the area of the freshwater marsh ecosystem becomes the freshwater marsh habitat type). We multiply the area of each ecosystem type in the user's vision by a parameter representing the proportion of the habitat in the ecosystem to determine the area of each of the nineteen habitat types.
Second, species-habitat associations are used to determine the area available to each species. Species with insufficient available habitat and introduced species (except for the 1609 case) are removed from the selected set of species ('potential species list').
Third, for each taxon, the species on the potential species list are sorted according to the area available to each species based on the species-habitat associations with the larger areas listed higher on the list. This process is repeated for each taxon.
Fourth, average probabilities of each taxon in each habitat (computed as the average of species-habitat probabilities) are then multiplied by the total habitat for each taxon. The total habitat (area) for each taxon is based on the taxon-habitat associations. Thus, for example, for freshwater fish, only freshwater marshes, ponds, and streams will be tallied. These values modify the areas used in the species richness calculations in the next step. This process creates differing areas depending on habitat types in the computation which consequently will create differing species richness predictions. For instance, user visions with large areas of natural habitat will maintain high areas after weighting with average probabilities of each taxon in each habitat since natural habitats have larger probabilities of species presence. These visions will predict a higher number for species richness. Inversely, user visions with heavily urbanized habitat will have reduced areas after weighting with average probabilities of each taxon since few species are adapted to urbanized environments and thus, we have lower probabilities of species presence in these habitats. Consequently, these visions will use lower area values in the SAR calculations and will predict a lower number for species richness.
Fifth, species richness for each taxon is calculated based on the taxon-specific SAR coefficients (a, b, and m) using the habitat totals from the previous step as area and latitude based on the user-defined climate scenario. These species richness values provide an upper limit on the number of species to select from the potential species list.
Finally, species are selected from the top of the list until the total species richness for the taxon is reached (calculated in the previous step). This list is the final product from the biodiversity module and includes species richness values and species composition.
Validation
Validation of the biodiversity model estimates is ongoing. Check back here for updates.