Visionmaker NYC version 1.0 Methods: Population
Eric W. Sanderson
Wildlife Conservation Society, 2300 Southern Blvd., Bronx NY 10460
19 January 2014
© Wildlife Conservation Society, 2014
Please submit comments or suggestions to m2409@themannahattaproject.org
The population model applies lifestyle-dependent densities to floor area estimates made for the user’s vision (and for Welikia (1609) and New York City (2014) visions for comparison) as described in the Geography model. Note that the lifestyle associated with Welikia (1609) is Lenape; the lifestyle for New York City (2014) is average new Yorker. The number of residents is based on the residential density parameter multiplied by floor area of residences, and modified by the lifestyle-dependent residential vacancy rate to account for unoccupied housing units. The number of workers is based on worker density that depends on lifestyle and use type (e.g. office, restaurant, retail, etc.) multiplied by the relevant floor use area and modified by a lifestyle-dependent unemployment rate. The number of visitors is based on visitor density, hotel area and a lifestyle-dependent hotel vacancy rate. Visitors to private residences are not included in the estimate.
From these population estimates, daytime and nighttime densities and number of households are estimated. Daytime density is the sum of residents, workers, and visitors divided by the area of the vision extent expressed in square kilometers. Nighttime density is based only on the number of residents divided by the vision extent in square kilometers. The number of households is based on a lifestyle-dependent household size parameter that is divided into the number of residents.
From the number of households, we estimate the number of dogs and cats using the lifestyle-dependent number of dogs and cats per household parameters. Other pet animals (e.g. chickens, bees, parakeets, hamsters, etc.) are not estimated.
Trips are estimated to drive fuel consumption estimates relevant to the carbon model from transportation. Personal trips on working days and non-working days (i.e. weekends and holidays) are estimated separately and then summed for an annual estimate. In each case, a trip generation rate density for working days and non-working days that depends on lifestyle and use type is multiplied by the appropriate floor area to estimate the number of trips per day. We extrapolate to annual estimates by multiplying by a lifestyle-dependent number of working days per year (or complementary nono-working days per year for weekends & holidays). Because we estimate the number of trips generated by each use category (e.g. residential, retail, restaurant, etc.) we can aggregate them by trip purpose. Trips represent both trips originating and destined to the vision extent. Trips represent both trips originating and destined to the vision extent.
The transportation submodel divides the number of personal trips generated in the vision extent by mode and trip distance using a lifestyle-dependent proportion of trips by mode and distance parameter. Trip distances are represented by a set of categories, each of which has a midpoint distance. Multiplying these midpoint distances by the number of trips in each category for each mode allows us to estimate the total distance travelled per mode to and from the vision extent reported as Miles per mode.
Freight trips, labelled as "deliveries and pickups," work similarly. The number of freight trips is estimated by multiplying a freight trip generation rate density by the floor area of various uses. The number of freight trips by mode is estimated by multiplying freight trips by a lifestyle-dependent proportion of freight trips by mode parameter. We estimate distance by freight mode by multiplying the number of trips by mode by an average freight shipment distance parameter that varies by lifestyle and freight mode.
Finally we make a very rough estimate of the vision's maximum trip capacity for different personal tranportation modes. Estimating transportation capacity is difficult because the model logic currently does not respond to the arrangement of ecosystems within the vision extent, only the areas of each ecosystem. To make a rough estimate, we treat each vision as if it were a square with an area equal to the vision extent area. We further assume that the ecosystems that have positive transport capacity for a given mode are arranged in a rectangle extending across the “square” vision extent. We estimate the width of that rectangle and multiply that width (estimated in terms of number of 10 m x 10 m cells) by a parameter representing an ecosystem transport capacity parameter, which is measured in terms of number of vehicle trips per day per 10m width, and then summing across ecosystems.
Validation
Block-level population estimates were compared against US Census 2010 block-level data for cases where Visionmaker NYC block geometry aligns with Census data (1623 cases used out of 1639 comparable geometries, out of 2900 total block-level visions). Visionmaker NYC vision population estimates were exported from the site and plotted against corresponding Census 2010 population counts (Figure 1). Selected outliers were removed.
Figure 1.
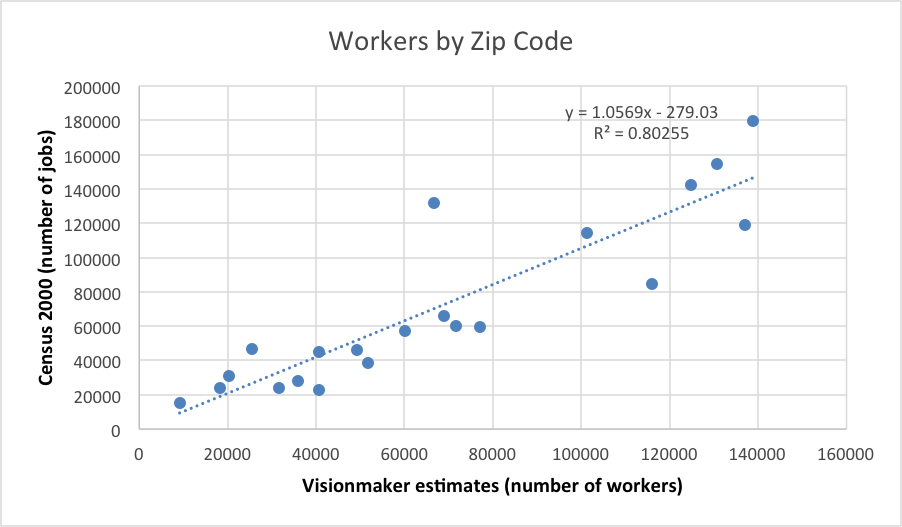
Figure 1. Comparison with linear regression between US Census 2010 block data and vision residential population estimates from Visionmaker NYC (based on 1623 blocks of comparable geometry).
Variation between Visionmaker NYC population model estimates and Census count data stem in part from variation in residential and worker density throughout Manhattan. Income, building typology, and zoning characteristics influence residential and worker density throughout the city, and these differences become clearer at the block level, but are not accounted for in Visionmaker NYC population calculations, where residential and worker densities are represented by a single figure across all of Manhattan. Note that the current residential density parameter was derived by dividing the population statistics given by the City of New York’s Department of City Planning’s Community District Profiles by the residential area of all lots in each Community District as reported by MapPLUTO. These densities were then averaged to produce an island-wide residential density.
Similarly, worker populations were compared between data from US Census 2000 tallies for zip codes and Visionmaker NYC vision estimates. (The above mentioned US Census 2010 data does not include employment information at the block level, nor have 2010 zip code-level employment statistics been published by the US Census). Census counts of workers age 16 and older were compared to daytime worker population estimates made on a per zip code basis (Figure 2).
Figure 2.
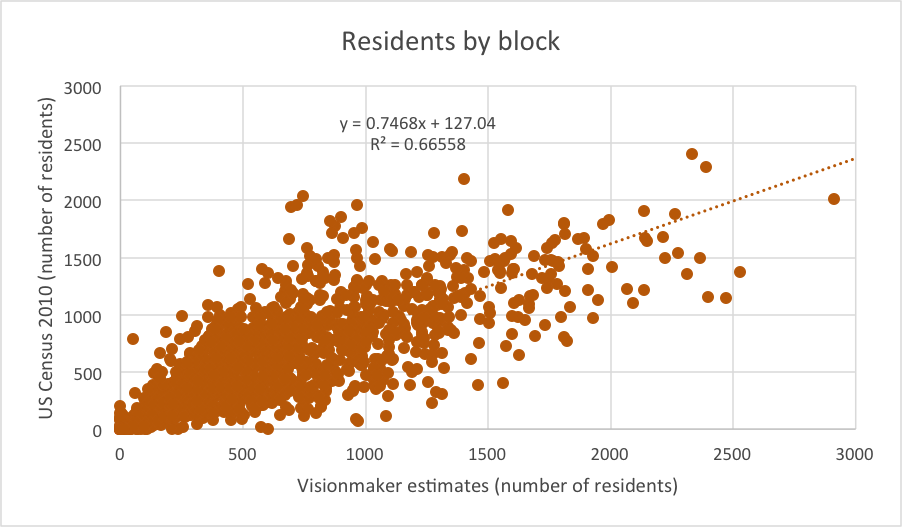
Figure.2 Linear regression comparison between US Census 2000 zip code data and Vision worker population estimates for Manhattan.